Grafana
| Plugin details | |
|---|---|
| Created by | K-Phoen |
| Category | Monitoring |
| Source | GitHub |
| Type | Open-source plugin |
Configuration
Application configuration YAML
This plugin requires a backend proxy configuration to make calls to Grafana with authentication.
In the following configuration, replace <grafana-url> with the Grafana instance (for example https://grafana.mycompany.com) and similarly replace public domain as well.
Make sure that the slash / is not added at the end.
If unified alerting is enabled in Grafana, then mark unifiedAlerting as true
proxy:
  /grafana/api:
    target: https://<grafana-url>
    pathRewrite:
      api/proxy/grafana/api/?: /
    headers:
      Authorization: Bearer ${GRAFANA_TOKEN}
grafana:
  domain: https://<grafana-monitoring-url>
  unifiedAlerting: false
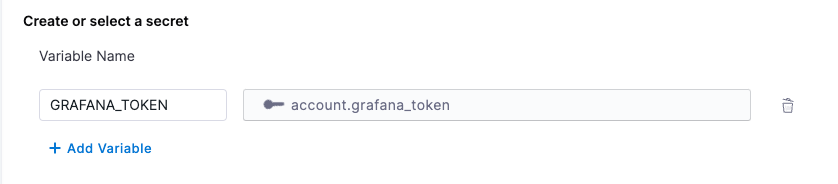
Secrets
Since the GRAFANA_TOKEN variable is used in the application configuration, you must generate a Grafana API key and set it as the value of GRAFANA_TOKEN. For instructions on how to create a Grafana API key, read the instructions.
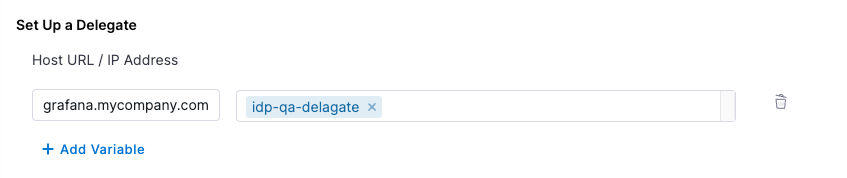
Delegate proxy
If your Grafana instance is hosted on a public cloud and can be accessed directly using a token, skip this section.
If your Grafana instance is self-hosted or has an IP address allowlist, include the base URL grafana.mycompany.com in the delegate proxy section.
When adding the host, include only the host name. Remove the protocol (HTTP/HTTPS) associated with it.
Layout
This plugin exports three UI cards that you can show on the Overview tab of a service or any other layout page. Go to Admin > Layout, select Service in the dropdown menu, and then add the following in the Overview section:
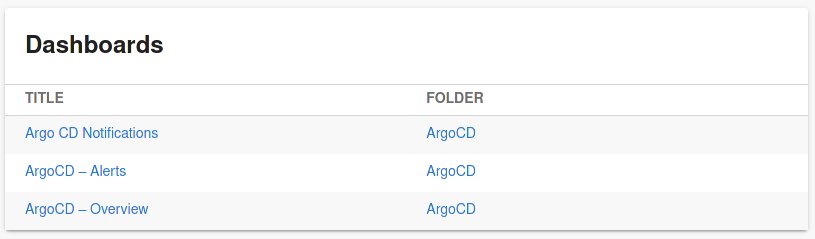
- component: EntityGrafanaDashboardsCard
specs:
gridProps:
md: 6
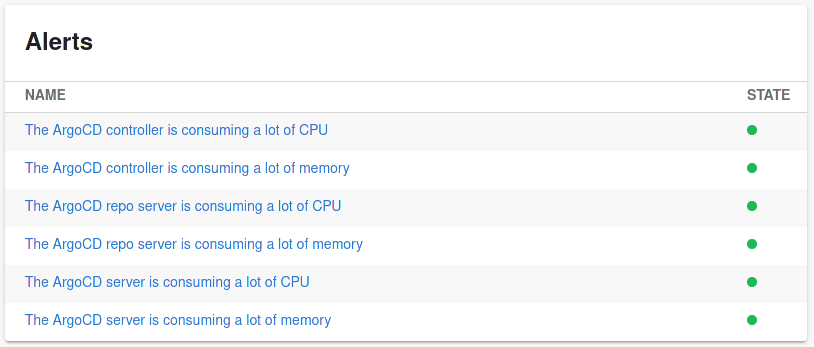
- component: EntityGrafanaAlertsCard
specs:
gridProps:
md: 6
- component: EntityOverviewDashboardViewer
specs:
gridProps:
md: 6
Full-height Grafana dashboard (important)
If you want the embedded Grafana dashboard viewer to render taller (for example “full screen height”), set the height inside specs.gridProps. If you place height under specs.props.style, it may be ignored/overridden by the layout grid.
✅ Supported example (recommended)
- component: EntityOverviewDashboardViewer
  specs:
    gridProps:
      md: 12
      xs: 12
      height: calc(100vh - 200px)
❌ Not recommended (may be ignored)
    - component: EntityOverviewDashboardViewer
      specs:
        props:
          style:
            height: calc(100vh - 200px)
Why: the IDP Layout system applies sizing through the grid container, so height overrides should be provided via gridProps for consistent rendering. So, if you notice the dashboard suddenly rendering shorter after previously working, validate that the height is still defined in gridProps (layout-level), not props.style (component-level).
Annotations
To configure the plugin for a service in the software catalog, set the following annotations in its catalog-info.yaml definition file.
The following selector will return dashboards under the folder folder-id and folder-name
metadata:
  annotations:
    grafana/dashboard-selector: "folderUrl == 'https://<grafana-url>/dashboards/f/<folder-id>/<folder-name>'"
Supported variables:
title: title of the dashboardtags: array of tags defined by the dashboardurl: URL of the dashboardfolderTitle: title of the folder in which the dashboard is definedfolderUrl: URL of the folder in which the dashboard is defined
Supported binary operators:
||: logical or&&: logical and==: equality (=== operator in JavaScript)!=: inequality (!== operator in JavaScript)@>: inclusion (left.includes(right) in JavaScript)
Supported unary operators:
!: logical negation
Annotation to embed the overview dashboard referenced by its URL
metadata:
  annotations:
    grafana/overview-dashboard: 'http://grafana/d/qSfS51a4z/some-dashboard?orgId=1&kiosk'
If Grafana's Unified Alerting is enabled, alerts are selected by a label defined on them:
metadata:
  annotations:
    grafana/alert-label-selector: "service=awesome-service"
If Grafana's Unified Alerting is NOT enabled, alerts are selected by a tag present on the dashboards defining them.
metadata:
  annotations:
    grafana/tag-selector: "my-tag"
The aforementioned annotations are suitable for displaying dashboards on a component page, you can as well display alerts on a component page and embed dashboards on a page.
Support
The plugin is owned by K-Phoen and managed in the K-Phoen's Plugin repository as an open-source project. Create a GitHub issue to report bugs or suggest new features for the plugin.